
Performance Monitor
Performance Monitor: In case when your PC runs slower or continues to freeze then it is performance issue that you need to tackle. It can be as a result of problems with apps, drivers, hardware etc.
Windows 10 comes with series of tools but in order to troubleshoot the performance problems of your system, Performance tab that exists in your Task Manager can be helpful. You will discover that performance monitor is a perfect tool that can help you view as well as analyze the hardware and application data so that you can resolve the performance related issues conveniently.
It also lets you customize the respective data in log files, generate reports, etc.
Table of Contents
Performance monitor – How to open it?
While working on Windows 10, performance monitor can be used to address data like hard drive, network usage, processor, memory etc., but in order to do the analysis it is important to learn the method to open it.
- Go to Start and search for – Performance Monitor and click on the result.
- Press Windows key+R using your keyboard which will open Run command where you need to type- perfmon and hit OK which will open it.
- Now press Windows key+X from your keyboard so that you open Power User menu and now select – Computer Management and click- Performance.
How to use performance monitor
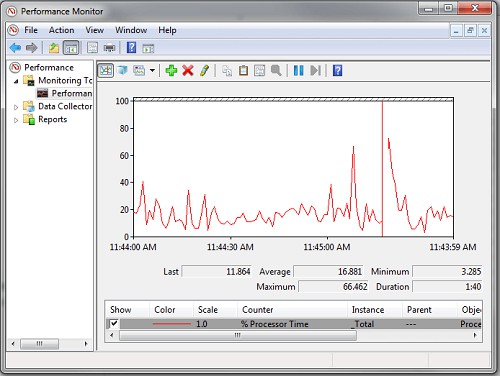
When you open the tool it will automatically open in just the main page which will give you an overview plus the system summary that will display the live data regarding network adapter, memory, processor usage and physical disk.
To your left you will see the navigation pane which will give you access to Performance monitor, reports and data collector sets.
Upon accessing the performance monitor you will view a screen that has single counter. This is basically the counter for Processor time which will list the details about the processor load in past 100 seconds.
The best part about this tool is you can easily add a number of counters to check almost anything on the PC.
How to add new counters to performance monitor
In order to include new counters (What is counter) to your hardware performance and monitor applications on your PC just follow the steps given below
- Click the button- Green plus which is located on top of performance monitor graph.
- Choose – Local computer/name of you own computer listed in drop down menu.
- Select and then expand category that list the item you wish to keep a track of like the category- Network adapter.
- Choose the specific counters you would wish to track
Important tips
If you are willing to include multiple counters, then just press & hold ctrl key and then click to choose every item you would like to add. You can even check the option- Show description to gain more information regarding each counter you select.
- If you like you can also select the respective instances you wish to check and you can monitor more than one instance at the same time.
- Now click – Add button
- To confirm click – OK
Ajit Yadav
Author Bio: Ajit yadav is a professional blogger and co-founder of WindowsClassroom. He is a software engineer by education and blogger & writer by profession.